Date
A calendar date. This anchors everything else: the positions of every body are read for that day, from the ephemeris rather than from a table.
Our Method
Memento Astra is built like a tool, not a mood board: you provide a recorded moment (date, time, and place), and the engine computes placements, houses, angles, and derived signatures. From that chart data, it produces a threshold reading, structured interpretation focused on transition, closure, and what endures.
From a date, a time and a place to a reading, in four steps.
You give us a moment and somewhere on Earth. We work out exactly where every planet was in the sky from there, build the chart that comes out of it, and read what the chart says. Nothing is looked up in a table and nothing is rounded off along the way, so the same details always give you the same chart, today or in ten years.
Validate date/time formats, handle missing time cases, and prepare inputs for timezone conversion.
Turn a human place string into coordinates (lat/lon), and derive the correct timezone for that location.
Compute planetary positions, angles, houses, and derived signatures (aspects, clusters, emphasis).
Generate a structured interpretation focused on transition, closure, and what remains from computed features.
Three things, in the words you would normally use for them.
A calendar date. This anchors everything else: the positions of every body are read for that day, from the ephemeris rather than from a table.
The time decides the angles and the houses, and nothing else. Without it the chart still gives you every planet and sign, and says plainly that the Ascendant and houses are missing rather than filling them in from an assumed noon.
A town and country, in plain words. It is resolved to a latitude and longitude, and to the timezone that place was actually keeping on that date, which is frequently not the one it keeps today.
Give the same date, time and place twice and you get exactly the same chart twice. Nothing is rounded off, cached from somebody else’s answer or nudged between runs.
The chart is not an image first. It’s data first.
Internally, the engine produces a chart object: positions, angles, house cusps, and derived features. The UI can render this as a wheel later, but the reading is generated from the structured results.
Planetary longitudes (and optionally speed/retrograde flags) form the baseline signature of the sky.
Ascendant/Descendant and MC/IC are computed from time + location, then house cusps are derived from the house system.
Tight aspects, conjunction chains, and stelliums are detected to find compression points where meaning concentrates.
Interpretation is structured, not improvised.
The death-time chart isn’t used to predict death. It’s used to describe a boundary: the geometry of entry/exit (angles), where meaning concentrates (house emphasis), and what is compressed into the moment (clusters/aspects). The reading is assembled from these measurable features.
Ascendant/Descendant and MC/IC are read as axes of passage: entry/exit, descent/ascent, private/public closure.
Loaded houses are treated as where the system concentrates meaning at the end-state: inheritance, remainder, release.
Tight configurations are treated as concentrated signatures, not “good/bad”. The question is: what becomes unavoidable here?
If you generate both charts, you can compare recurring signatures: repeated angles, repeated house emphasis, repeated planetary relationships. Repeats can suggest continuity; reversals can suggest release; closure patterns can suggest resolution. The comparison is meant to be readable, not mystical.
Common questions about method and accuracy.
They move quickly relative to clock time. If the recorded time is off by minutes, angles can shift noticeably, which changes the reading structure.
Yes. Placements can still describe the sky’s baseline signature. But for a threshold reading, you’ll usually want to test a time window to understand angle/house sensitivity.
You can generate any chart data, but the method and language on this site are tuned for transition and closure. Use the birth chart tool for baseline work.
A structured chart object (data-first) that can be rendered visually, plus a reading composed from computed features like angles, house emphasis, and tight configurations.
The parts of a chart, explained from scratch.
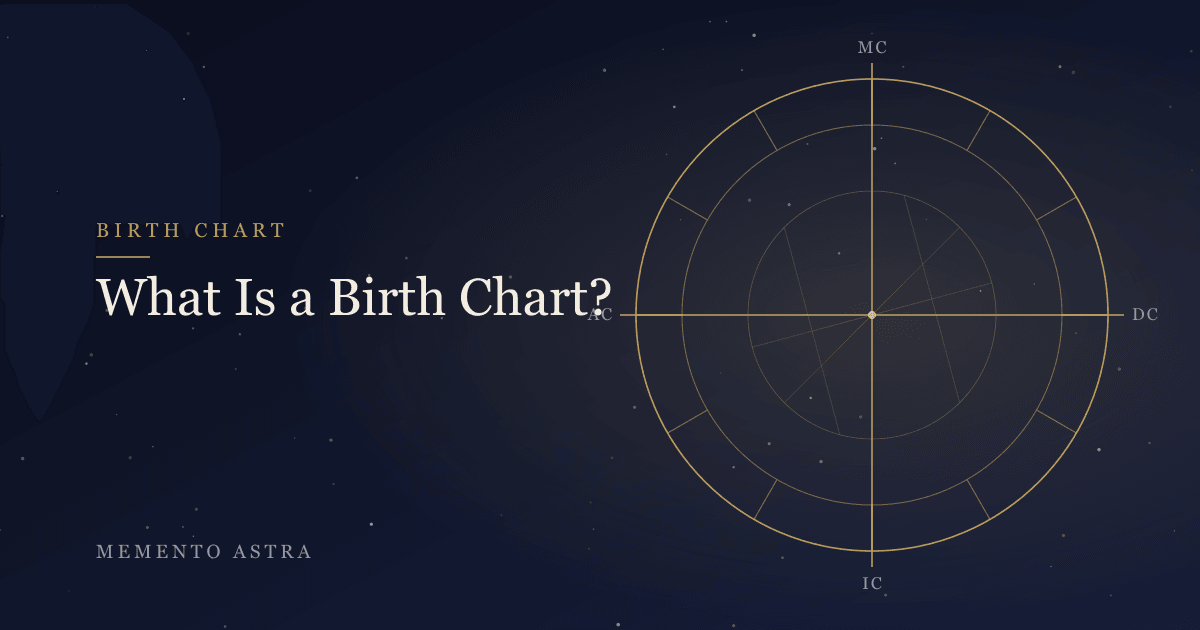
A birth chart maps the sky at the exact moment you were born. Here is what every part of it means, and how to read yours from scratch, no jargon.
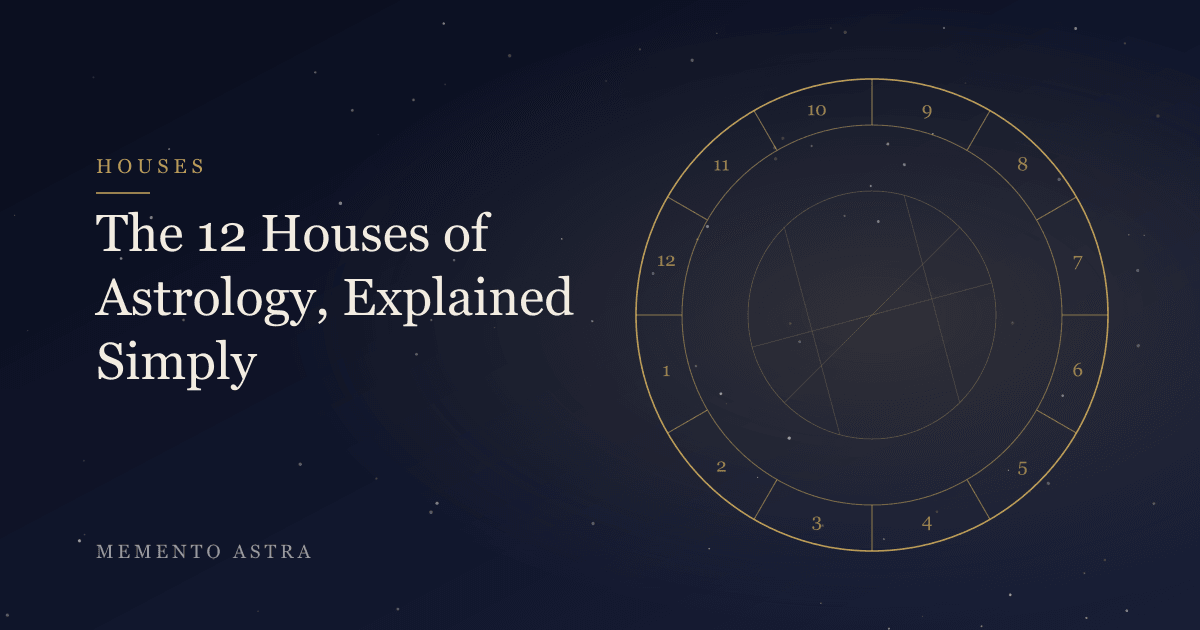
Houses are where astrology stops being vague. What each of the twelve governs, how to read an empty one, and why two chart calculators can disagree.

All ten planets in your birth chart explained: what each governs, how fast it moves, and why the outer three say almost nothing about you personally.